
Insights
Dashboard
A single view of review health across every connected app
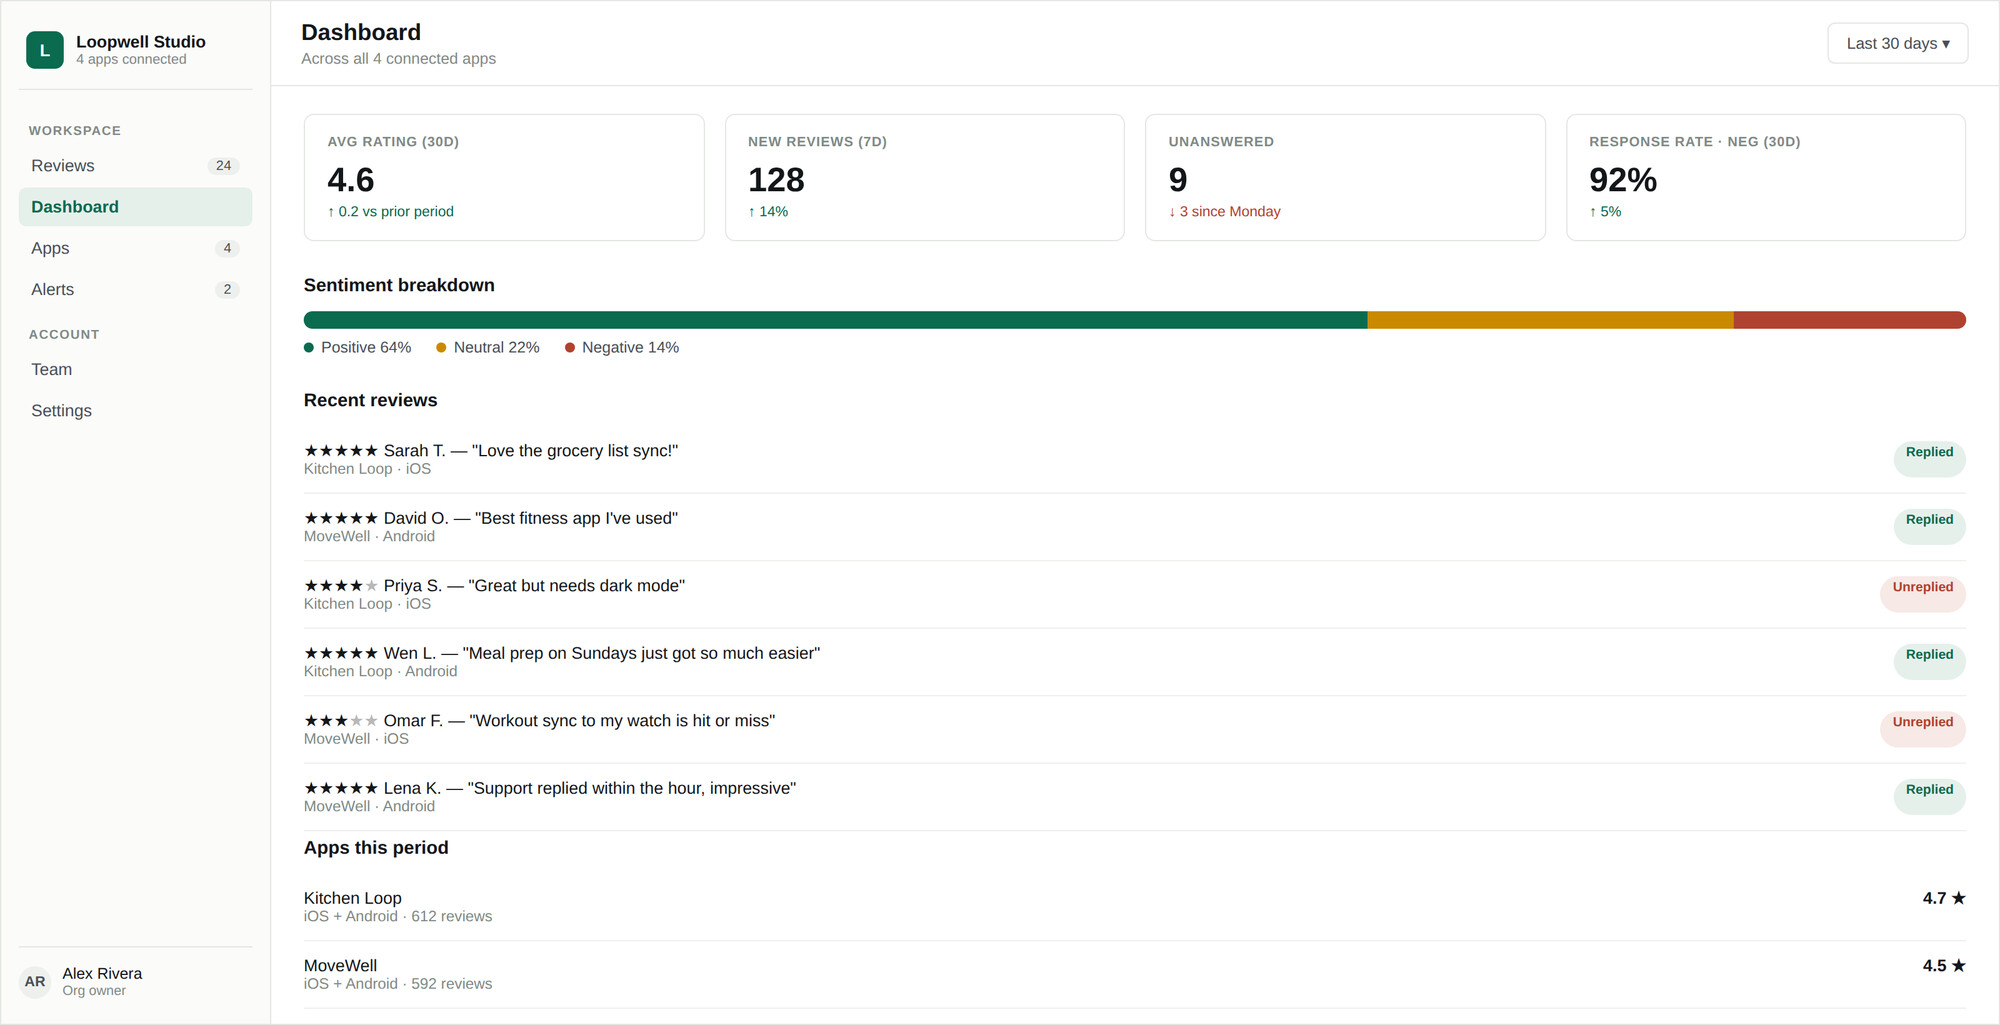
The dashboard answers one question: is anything getting worse? Every figure carries a comparison against the previous period, because the absolute number matters far less than the direction.
Headline metrics
| Metric | What it tells you |
|---|---|
| Avg rating · 30d | Rolling average star rating across all apps, with the change against the prior period. |
| New reviews · 7d | Incoming volume over the last week, so a spike is obvious early. |
| Unanswered | Reviews with no reply — the number to drive toward zero. |
| Response rate · negative · 30d | Share of negative reviews you replied to. The one metric that most reflects whether triage is working. |
Rating drop strip
If a rating has fallen sharply, a strip appears at the top of the dashboard before you have to notice it in the numbers. It can be dismissed, and the same condition also raises an alert so it reaches you when you are not looking at the screen.
Sentiment breakdown
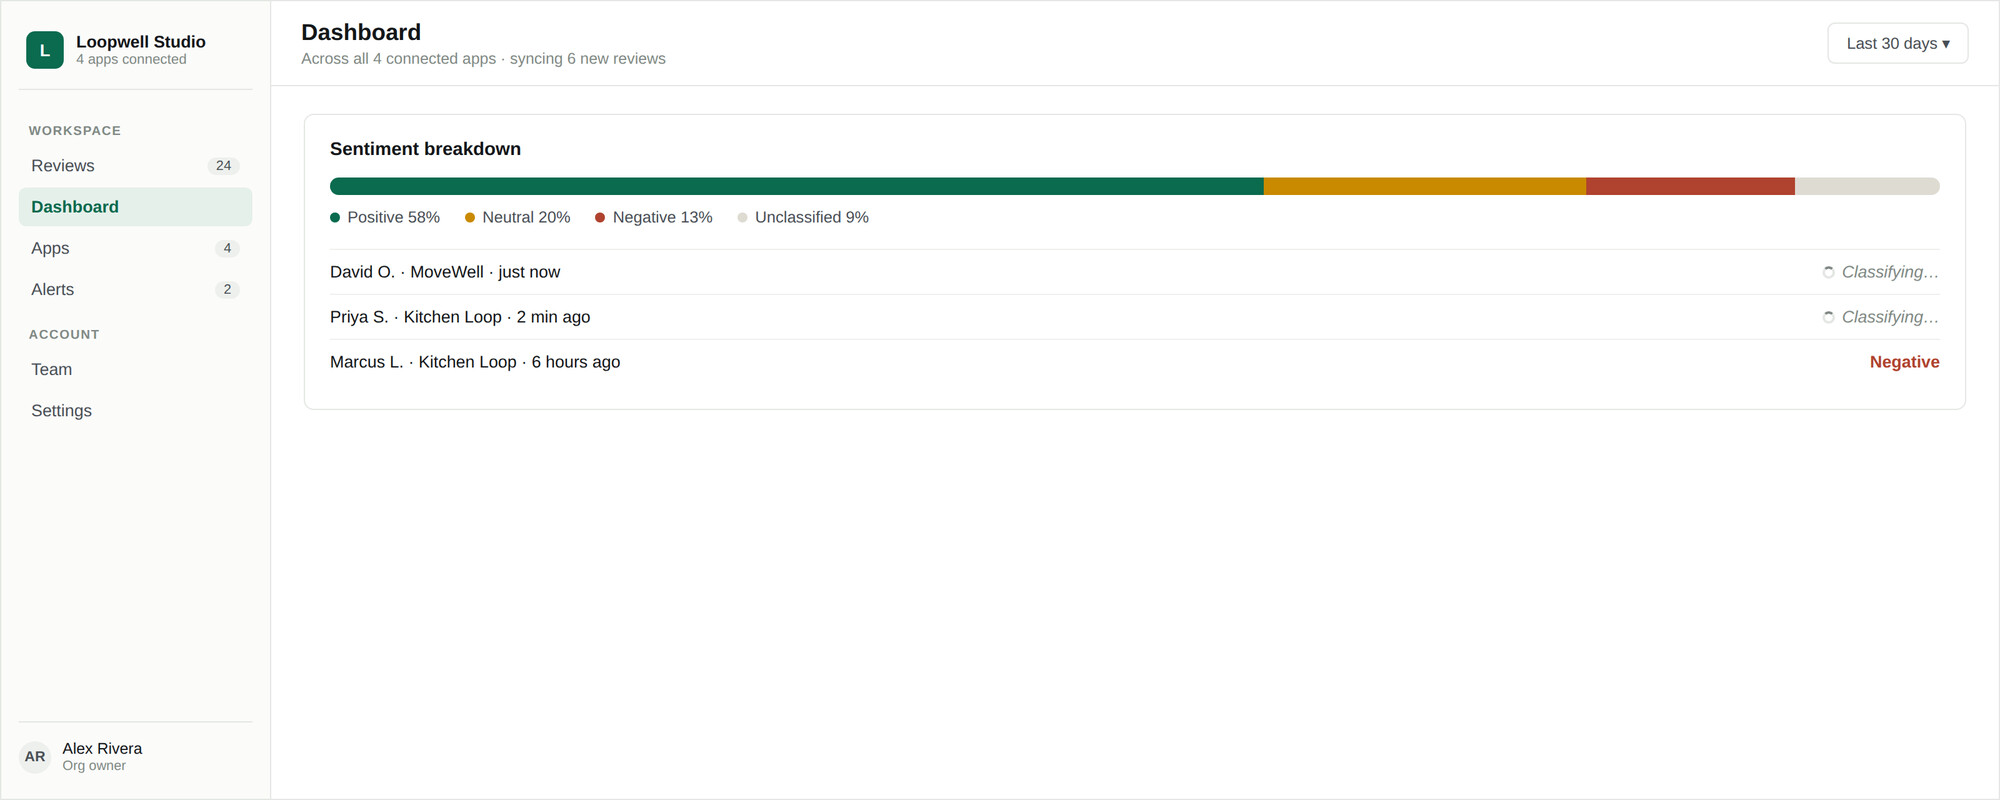
A breakdown of positive, neutral, and negative across the period. Newly synced reviews show as still being classified until the next classification pass runs — see Sentiment and themes.
App health
A per-app table so a single bad app does not hide inside a healthy portfolio average. This is usually where you spot that one client’s rating is sliding while everything else holds steady.
Theme trends
The topics coming up most in review text, and whether each is rising or falling against the previous period. A coverage indicator shows how much of your review volume has been classified, so you know how much weight the trends deserve.
Recent reviews
A live feed of the latest reviews across every app, tagged by platform, so you can jump straight into a conversation without going to the inbox first.